n8n interface tour: what the canvas, nodes, and execution records each tell you


After installing n8n and logging in, the first look is confusing: a narrow icon-only bar on the left, a large dot grid in the middle, a grayed-out "Publish" in the upper right, and an orange "Execute" bar at the bottom. Everything looks clickable, but after clicking you can't say what just happened.
This article walks through the order you'll actually follow: first look at the left, then the canvas, then double-click a node, and finally go through the execution records.
The goal is specific—after reading, you can distinguish three things:I'm changing the workflow、I'm running a particular execution、I need to check which execution went wrongOnce these three are clear, learning nodes later will save half the effort.
Suitable for people who can already open n8n but have not yet run a workflow through. Those who just installed it following the previous article are the best fit; no code needed.
- The row of icons on the left
- What is actually usable on the canvas
- Adding a node: type English in the search box
- After double-clicking a node: four tabs
- What the execution records are saying
- Manual execution and production execution: don't mix them up
- Four actions to verify you really understood
- Six pitfalls you'll encounter
- Two security issues related to the interface
The interface is organized around three concepts
There are only three things you really need to remember in n8n:Workflow(the flow you wrote),Node(one step in the flow),Execution(one run of this flow).
The interface is just a projection of these three things. The left side manages resources—workflows, credentials, and execution records are all stored there; the middle is the flow itself; the node panel answers “what does this step do”; execution records answer “how did the last run go”. The positions look messy, but that’s actually how they’re divided.
The easiest thing to confuse is “workflow” and “execution”. Editing a workflow does not touch execution records that have already finished, and running an execution does not change the workflow. They are two separate things.
This instance of mine is self-hosted 2.43.7, and the interface language is set to Simplified Chinese. One detail to clarify first: only the shell is translated into Chinese; node parameters are still in English—Mode, Fields to Set, Include Other Input Fields, and so on. Don’t think the language pack is wrong when you see that. The same goes for searching nodes: typing English names gives a higher hit rate.
That row of icons on the left
By default it is collapsed, showing only icons; a tooltip appears only when the mouse hovers over it. Click the topmost button with the arrow to expand it; after expansion it looks like this:
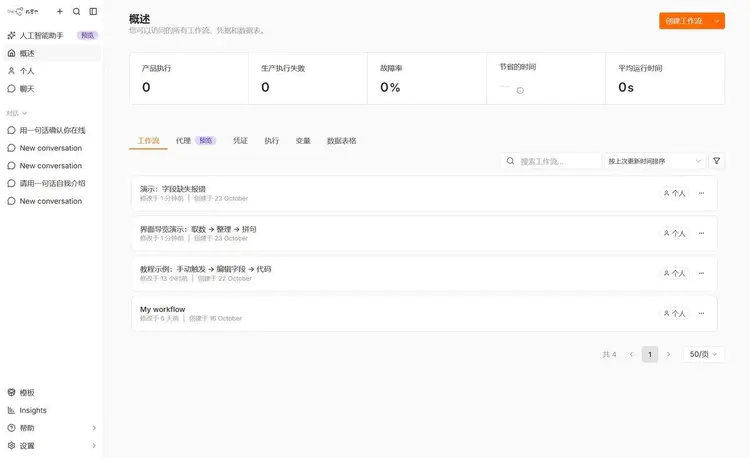
You will spend 90% of your time only in “Personal”. Your own workflows, credentials, execution records, variables, and data tables are all on the “Personal” page, switched via tabs, so you don’t have to jump back and forth.
“Overview” is the page for the boss: production execution count, production execution failures, failure rate, average runtime. On a freshly installed instance they are all 0, which is normal—it only counts production executions; the few times you clicked manually are not included. The first time I saw a row of 0s, I thought the instance wasn’t running.
By the way, a note on the translation: the “产品执行” card—the English original is production executions—refers to executions run by triggers after going live. It does not mean “product”.
Settings is at the very bottom, and it’s the easiest to fail to find. Changing your password, changing the language, and checking the version number all start from there.
What is actually usable on the canvas
Open a workflow, and the dot grid in the middle is the canvas. My demo flow has three nodes:
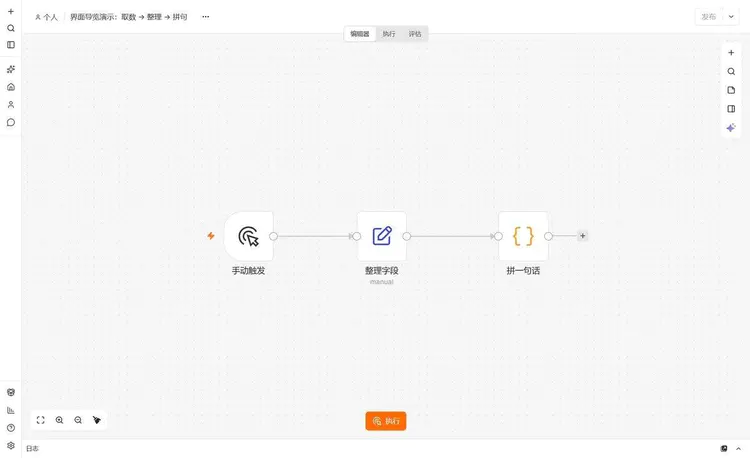
Top row: on the far left is “Personal / workflow name”; clicking the name lets you rename it directly; in the middle are three tabs “Editor / Executions / Evaluations”; in the upper right is “Publish”.
This middle row of tabs deserves explanation. “Editor” is where you draw the flow; “Executions” is the historical runs of this workflow; “Evaluations” is a feature for running a batch of test data repeatedly to see whether the results are stable. A friend of mine who does AI workflows uses the third one; I still haven’t seriously touched it, so let’s leave it aside for now.
The “Publish” in the upper right is a redesigned feature in 2.x. The Active switch in old tutorials is gone: edits automatically save drafts, usually persisted within 1 to 5 seconds, and only clicking “Publish” pushes the current version live; production executions only recognize the published version. If the button is grayed out, it means there are no changes to publish, not that it’s broken.
Five vertical buttons on the right: add node, command bar (Ctrl/Cmd + Kwhere you can search for nodes and actions), sticky note, focus panel, AI. At the lower left are fit view, zoom in, zoom out, and Tidy up; the orange “Execute” in the bottom center is what runs the entire flow.
Nodes also have buttons, which appear only when you hover over them: execute this step alone, deactivate, delete, more. Deactivate is much more useful than delete—when debugging, turn off the nodes you don’t want to touch, the flow will skip them, and one click restores them when you change back. If you delete them, you have to rebuild.
Add node: type English in the search box
Click the plus sign on the canvas, or press Nand the node panel slides out from the right:
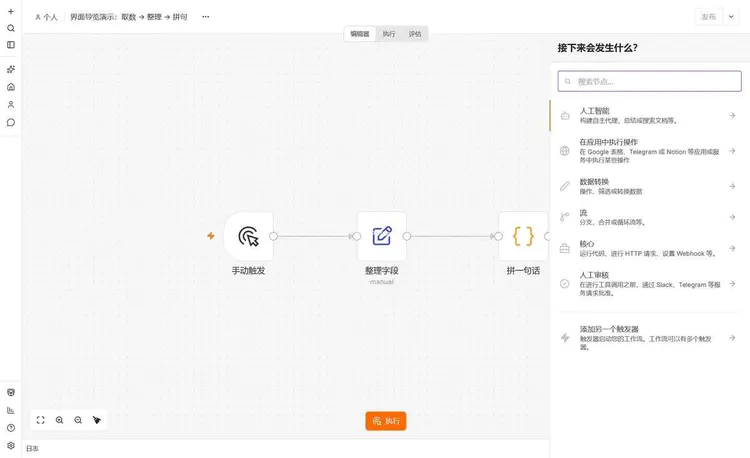
The groups are only for convenient browsing; if you really want to be fast, just search. The three I type most often:set(Edit Fields),code(write JS),if(conditional branch). Searching in Chinese for “Edit Fields” also brings it up, but once there are many nodes, Chinese matching often gives you a bunch of irrelevant results; English is more accurate.
That “Add another trigger” is not just for show. When the same workflow needs to run on a daily schedule and also be woken up by a webhook, add a second entry point here; no need to create two workflows.
After double-clicking a node: four tabs
Double-click any node to open the node details. This is the screen you spend the most time on in n8n:
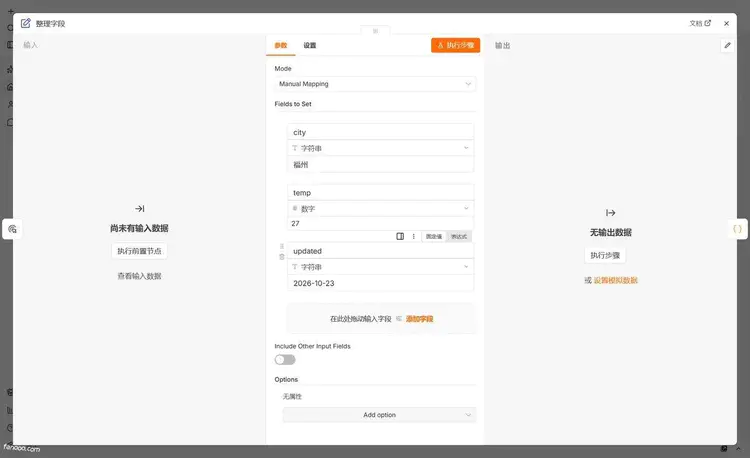
Let’s go through the four tabs one by one.
InputThis is the data the upstream gives to this node. At the top you can switch between “Schema / Table / JSON.” Schema only shows the field structure of the first item, which looks clean but may miss fields; Table and JSON show everything. When checking “what the upstream actually gave,” I basically always dig through the JSON tab.
ParametersThis is what you need to fill in. To the right of each value are two small buttons; “Fixed” means hard-coded, and only after switching to “Expression” can you write {{ }}. Many “why didn’t my change take effect” problems ultimately come down to the value being filled in under Fixed.
SettingsThese are node-level switches. They aren’t commonly used, but when something goes wrong they’re the lifesavers: Always Output Data (force output an empty item even when there’s no data), Execute Once (run only one item regardless of how many items there are), Retry On Fail (retry on failure), On Error (stop the whole workflow after an error, or continue downstream). Notes can be used to write remarks for a node; check “Display note in flow?” and they’ll be printed on the canvas—very useful when taking over someone else’s workflow.
OutputThis is what the node outputs after it finishes running.
Beginners most often get stuck because the output is empty. The reason is usually not complicated: this node hasn’t run yet. Click “Execute step” in the top-right corner; it will run the preceding nodes as well and then show the result on the right:
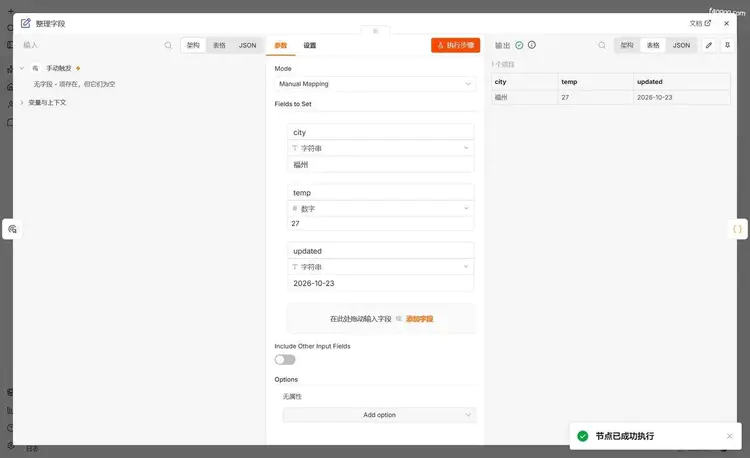
This line of small text is worth a second look. It says: the upstream did give one empty item, only this item has no fields. So your workflow can continue downstream, but accessing $json.xxx will be undefined. The first time you encounter it, it’s easy to think the trigger is broken; in fact, it’s like that by nature.
You’ll see the number “1 item” every day from now on. If the upstream gives 10 items, and it says 10 items here, the node runs once for each of the 10 items, not just the first one. Remember this, and you’ll be able to explain most of the later “why was only one item processed” questions yourself.
After execution, a “Node executed successfully” message pops up in the bottom-right corner. Seeing it means this step’s configuration is fine; if you don’t see it, first read the original error message that pops up, and don’t rush to change parameters.
What the execution record is saying
After the entire workflow finishes running, the canvas looks like this: nodes get checkmarks, connections are labeled “1 item,” and a “Clear execution” appears in the bottom-left corner.
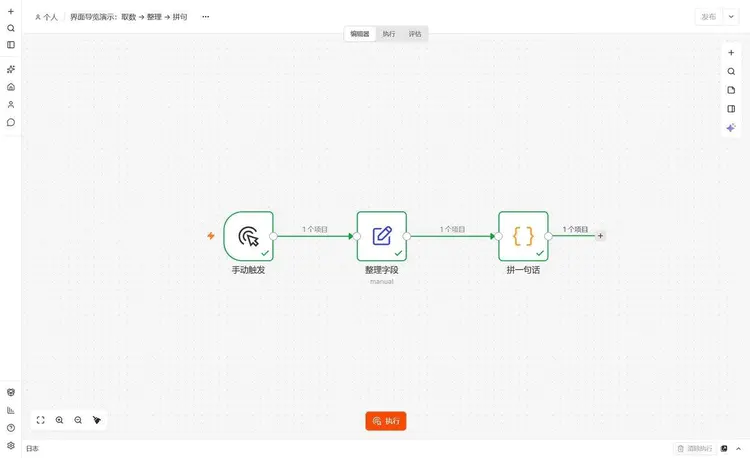
But these colors only represent the most recent run. To look through history, go to execution records. Two entry points: the “Executions” tab at the top of the workflow, which only shows this workflow; and “Personal → Executions” on the left, which shows all workflows across the site.
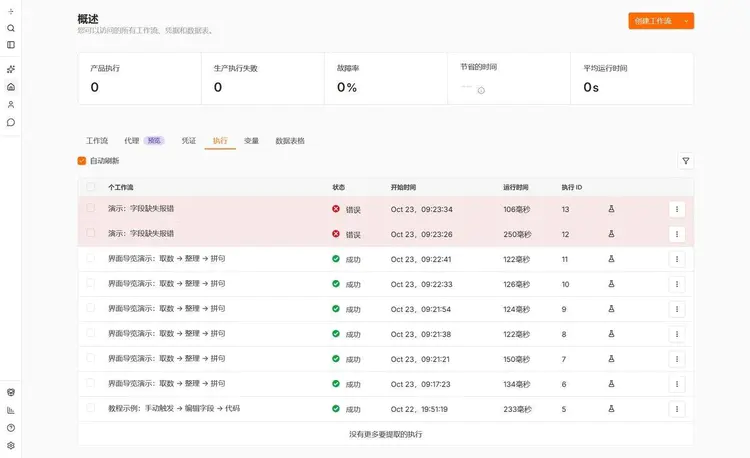
The columns are straightforward: Workflow, Status, Start Time, Runtime, Execution ID. Failed rows are marked red across the entire row, so you don’t have to search row by row. There are also filters in the upper right, which can filter by status, by time, and by workflow—once you have many workflows, you have to use them.
Runtime is in ms. For the entries above, the fastest is 106 ms and the slowest is 250 ms; both are on the scale of a few dozen lines of local code. For workflows that call external APIs, hundreds of ms to several seconds is normal—don’t assume it’s slow just because you see three digits.
Clicking into one opens the single execution:
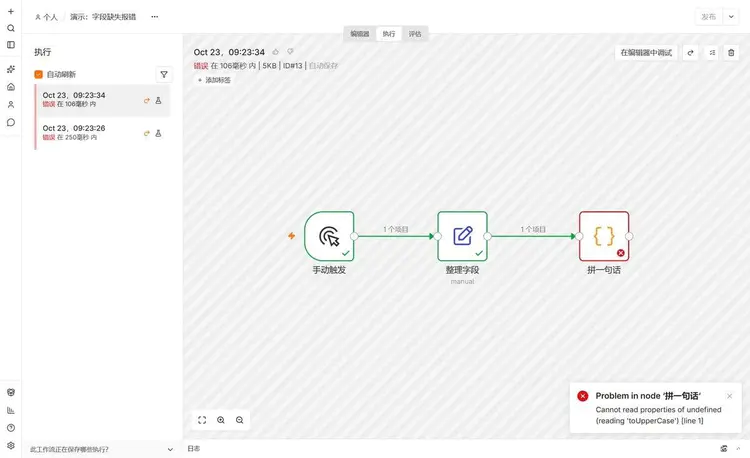
The top line has very high information density: time,error within 106 ms, 5KB, ID#13, Auto-save. 5KB is the size of the data saved for this execution, and ID is that column in the list. The “Auto-save” after the ID means this run was automatically archived according to the workflow settings, not manually saved by you.
The left column is other executions of this workflow; click one to compare before and after. In the middle canvas you don’t need to click run—just look at which block is marked red to know which step it broke at. “Debug in editor” in the upper right can move this execution’s input back into the editor and rerun it without retriggering upstream—saving time and also saving the quota from repeatedly calling APIs.
There is also a “Logs” panel at the bottom; expand it to see the start and end time of each node. To investigate “which step is actually slow,” look at it—it’s more reliable than guessing runtime from the list.
Don’t mix up manual executions and production executions.
A manual execution is the run you get by clicking “Execute.” The result is drawn directly on the editor canvas, you can inspect data step by step, and it’s suitable for changing and testing as you go.
A production execution is the run that the trigger runs by itself after the workflow is published. Itwill notshow on the editor canvas; you can only go to the “Executions” tab to look through it.
So for problems like “It clearly ran successfully, why is there no response online,” eight out of ten are because manual execution was mistaken for going live. A successful manual run only proves the logic is correct; to make schedules or webhooks actually take effect, you still need to click publish. Old tutorials have misled many people on this point, because they talk about the Active switch in 1.x.
There is an even sneakier pitfall: the canvas says “1 item,” but that item is empty, or there are simply 0 items. When there are 0 items, the following nodes don’t execute at all, yet this execution is still marked “Success.” This kind of “succeeded but did nothing” is the hardest to troubleshoot, and I’ll write about it separately later.
Four actions to verify you really understood
Looking at the images doesn’t count; walk through it hands-on:
- Create three nodes (Manual Trigger → Edit Fields → Code) and click “Execute.” All three nodes turn green, “1 item” appears on the connection, and “Clear execution” appears in the lower left.
- Double-click the last node; in the Output tab you can see fields and values, not “No output data.” If you can’t see them, click “Execute step” and try again.
- Switch to the “Executions” tab; the run just now is in the list, the status is Success, and the runtime is tens to hundreds of ms.
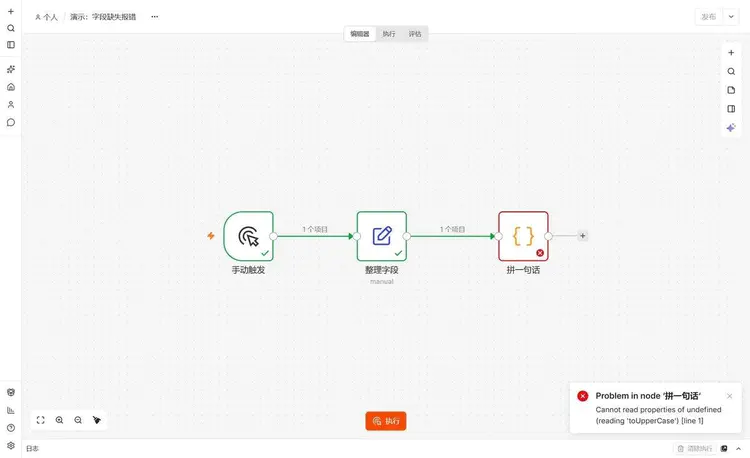
- Deliberately change a field name in the code to something wrong—for example, reference a field that doesn’t exist upstream at all—and run it again. That node turns red, an error pops up in the lower right, and a red entry is added to the executions list.
Don’t skip the fourth step. Understanding what failure looks like is far more useful than understanding success.
Six pitfalls you will run into
Can't find the Active switch.In 2.x it was changed to "Publish". If you follow 1.x tutorials, you will never find it, and then you start wondering whether what you installed is actually n8n.
You think the language pack wasn't installed properly.Chinese UI with English parameters is normal. Mode, Fields to Set, Include Other Input Fields are just English; there is no Chinese version.
The output is always empty.The node hasn't been executed yet. Click "Execute step", or click "Execute previous nodes" in the input area. Historical data in execution records will not automatically backfill into the editor; the two datasets are separate.
报 Cannot read properties of undefined (reading 'toUpperCase')。It says exactly what it means: a field does not exist, and you are still calling a method on it. Nine times out of ten the upstream field name is wrong, or a small number of records simply do not have this field. Going back to the previous node to look at the output is ten times faster than guessing in code.
The code I deliberately broke for the screenshot looks like this; it references a field that upstream never provided:
return items.map(item => ({
  json: { order: item.json.order_no.toUpperCase() }
}));
Execution records disappear after a few days.Pruning is enabled by default: older ones are deleted after 14 days or when the total exceeds 10,000. If you want to keep evidence, add a tag to that execution ("Add Tag" in execution details); tagged ones are not subject to pruning.
If you delete a node, you can't get it back.Deleting on the canvas has no recycle bin. When unsure, deactivate instead of deleting.
Two security issues related to the interface
Execution records storethe raw input and output data of each nodeAny plaintext passwords you wrote in parameters, API keys you pasted in, and customer phone numbers you queried will, as long as they pass through a node, be fully stored in the execution data. Anyone who can open the execution record can see these.
So always use Credentials for credentials; don't stuff them into a Set node or code; if you used sensitive data during debugging, delete that execution after it runs. Credentials store references, while execution records store values; remember this distinction.
One more thing that's easy to forget: before sending a screenshot, check whether the execution details contain email addresses, tokens, or internal network addresses. The workflow I used for screenshots this time was a temporary demo workflow and was deleted after taking them, for exactly this reason.
Summary
There are really only three places to remember in this interface: the left manages resources, the middle manages workflows, and the top right manages publishing. Double-click a node to view data, and switch to the "Executions" tab to view history.
The rest—variables, data tables, evaluations, agents—will only add another layer of confusion if you click into them now; wait until you actually need them.
For the order, I recommend getting familiar with execution records first, then learning expressions. Once you can see at a glance where an execution stopped and what upstream provided, learning any node later will be faster.
Next post
Next, the selection discussion: where exactly n8n, Zapier, and Make differ—run through it by price, flexibility, and maintenance cost. To see the overall arrangement, go toCourse table of contents。
The previous post isHow to install n8n: a complete tutorial for beginners on local deployment and first runIf you get stuck during installation, go back to that post.
References
- Save and publish workflows (official)
- Work with nodes (official)
- Differences between manual, partial, and production executions (official)
- Keyboard shortcuts (official)
- Execution data retention and pruning (official)
Last updated: October 23, 2026, using n8n 2.43.7.